This post highlights the new Independent mode of testing introduced in XJRunner from version 2.3. Group mode was covered in an earlier entry.
Independent mode
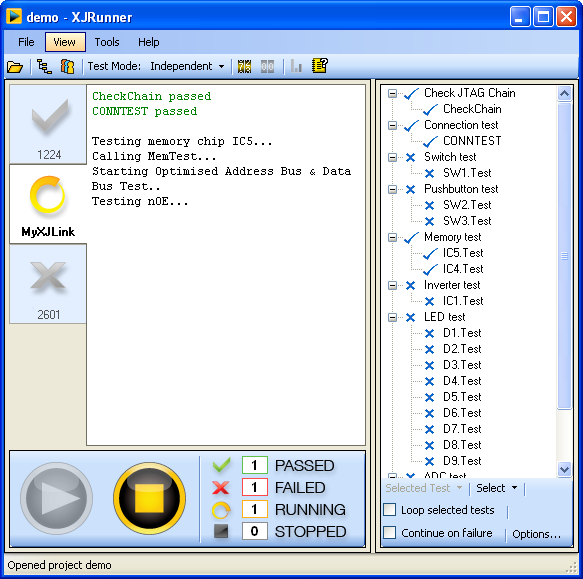
This can be quickly distinguished from Group Mode by the fact that the tabs corresponding to the plugged in XJLinks do not have checkboxes. In this mode the XJLinks operate independently. Clicking the Run/Stop buttons will start/stop tests only on the XJLink the tab of which is currently selected. You can run tests on a different XJLink by selecting its tab and then clicking the Run button; the tests will run on this unit independently of whether tests are running on other units. Note that if you have an XJLink2, you can run tests on it by pressing the Run button on the XJLink2 unit without having to select its tab first.

If a new XJLink is plugged into your machine while tests are running, it will get its own tab on the main testing screen and you can start tests on it immediately. Once testing has finished it can again be started independently of the other units.
In this mode, serial numbers are entered separately for each board on the pop-up dialogue when testing begins on this XJLink. When testing finishes on an XJLink, the pop-up window at the end will show results only for this board.
Cumulative test results analysis
A very useful feature of this mode is the ability to show cumulative total results of the tests which have been run. If Tools -> Counting is enabled, the counters of the summary pane at the bottom of the screen will show how many boards have passed, failed, are currently running tests or have had testing stopped during the current session.
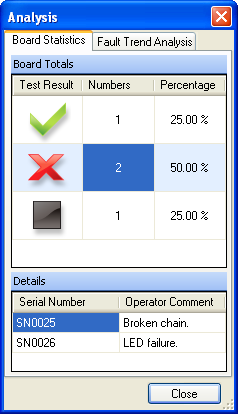
A more detailed statistical analysis of the cumulative test results can be seen on the Analysis dialogue, which can be launched by clicking the View Totals button on the main toolbar. The Board Statistics tab shows you numbers and percentages of the boards that fall into each category of results (Passed, Failed, Stopped) along with their serial numbers and the user comments (if any).

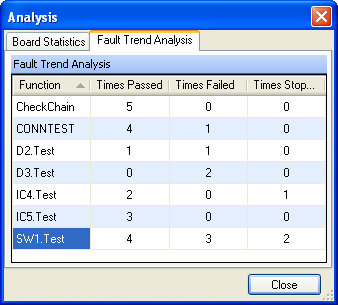
The Fault Trend Analysis tab gives you the total number of the test functions that have passed/failed on all of the tested boards, i.e. you can view the most common test failures and identify the most problematic bits of your system or weak parts of your test code.

If you want to exclude boards from the statistics and run tests without altering the cumulative tests results, for example when debugging a board, you can pause counting by pressing the Counting button. Counting can be resumed by pressing the button again. The cumulative test results can be reset at any time by clicking the Reset Counters button on the main toolbar.

Leave A Comment