An interactive XJEase debugger was added in XJTAG 3.2. This can be used to help find problems in your XJEase code.
This blog post assumes you know what a debugger is – and the principles of using one. If you don’t then there are many excellent websites and books that will teach you the fundamentals.
When can the debugger be used
The debugger is only available in XJDeveloper. You cannot debug XJEase code from XJRunner or XJInvestigator.
Within XJDeveloper, it can be used whenever XJEase code is run:
- When XJRunner tests are run
- When an XJEase function in a TRST sequence is run
- In a Board Initialisation Function (runs before Debug Connection Test or XJAnalyser start)
Setting a breakpoint
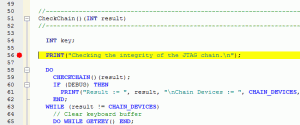
XJEase code will run as normal in XJDeveloper – until a breakpoint is reached. When a breakpoint is reached execution of the XJEase code will pause. The line that is about to be executed will be highlighted in yellow.

Breakpoints can be set in both the Test Device File editor, and the Circuit Code File editor. With the cursor on the line where you would like to add a breakpoint do one of the following:
- Press F9
- Click in the margin to the left of the text
- Click “Toggle Breakpoint” from the “Debug” menu
- Click the “Toggle Breakpoint” button on the toolbar
XJEase variables
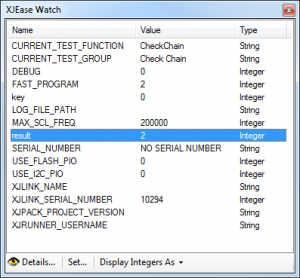
When execution is paused the XJEase Watch Window will show the current values of all the variables visible at the location where execution is paused.
This can be a valuable tool in working out what is happening in the XJEase code. Large integer variables (such as flash images) will be shown in a hex viewer.
Controlling execution
When the debugger is paused, there are several actions you can take to control the debugger. These allow you to step through the code, to follow what is happening. The options for controlling the debugger are available from the “Debug” menus on the code editors, and on the Run Tests screen.


Leave A Comment