One of the exciting new features in version 3.4 of XJTAG is a Waveform View that can display the JTAG chain data from XJAnalyser.
The Waveform View can display the waveform traces from pins or buses in XJAnalyser in real time, providing useful debug information for your boards. Once the data is captured, it supports a high level of interactivity, with responsive and intuitive scrolling and zooming allowing you to find the information you need quickly and easily.
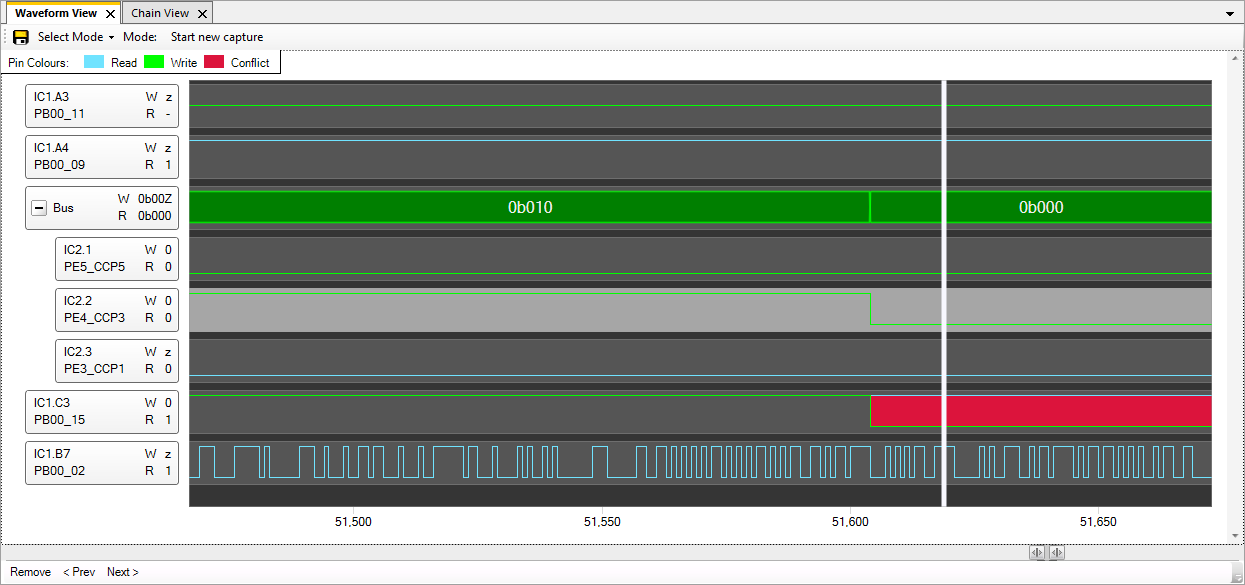
The Waveform View
As well as displaying live data, the Waveform View also supports triggering, allowing you to leave it running for long periods of time and then break and capture the key information to track down intermittent faults on your boards.
By putting the devices in the chain into SAMPLE mode, it is possible to observe their normal functionality, even under BGAs where a standard logic analyser cannot reach. The Waveform View also supports the same pin driving and toggling functionality from the Chain View in XJAnalyser, allowing you to drive signals from JTAG and watch if the rest of the board responds as expected.
The Waveform View can provide lots of useful information when debugging hardware, either as part of the design process or as part of the repair process.
Leave A Comment