Having lots of information is great, but sometimes the most difficult thing is displaying that data in a meaningful way. We have created two new information overlays for Layout Viewer, allowing you to visualise test coverage statistics or live pin data from Analyser on your board layout.
Test Coverage
We already carry out Design For Test (DFT) analysis of a project in XJDeveloper, and can produce a number of reports using this data. We can now overlay this information onto the layout of the board, making it easy to see test coverage at a glance. All of our DFT information is available before you have any hardware, making this particularly useful for highlighting areas of the board with poor JTAG access early in the design process.
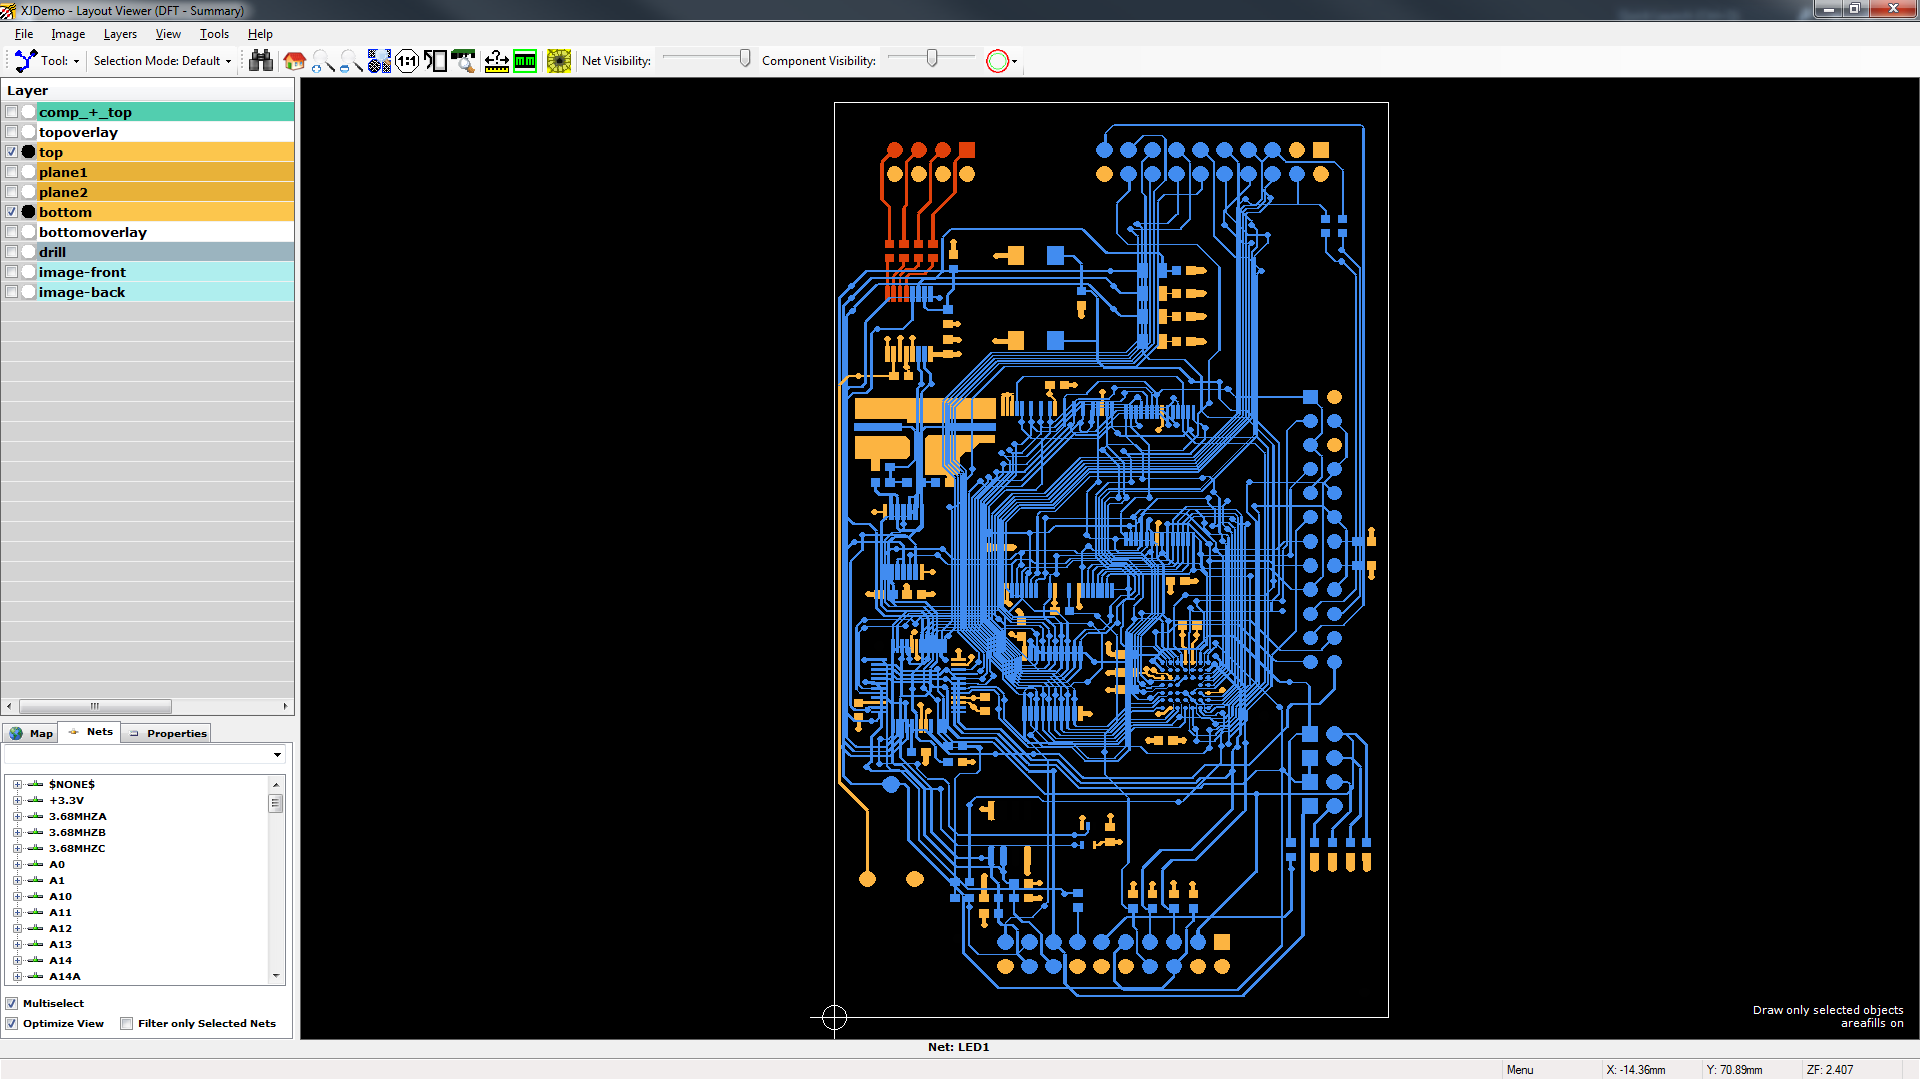
Test coverage statistics for the XJTAG demo board
In this diagram, the blue nets are tested, the orange nets are power/ground, and the red nets are untested. We can see that the overall test coverage is very good – the untested area in the top left is the analogue header and ADC chip.
This view is launched from the summary toolbar on the DFT Analysis screen, or from the Tools menu.
Analyser Pin Data
The live pin data displayed in Analyser can also be displayed on the Layout Viewer, updating in real time as the net values on the board change. This view is available in XJDeveloper and XJInvestigator, from the Analyser->View menu that appears while on the Analyser screen.
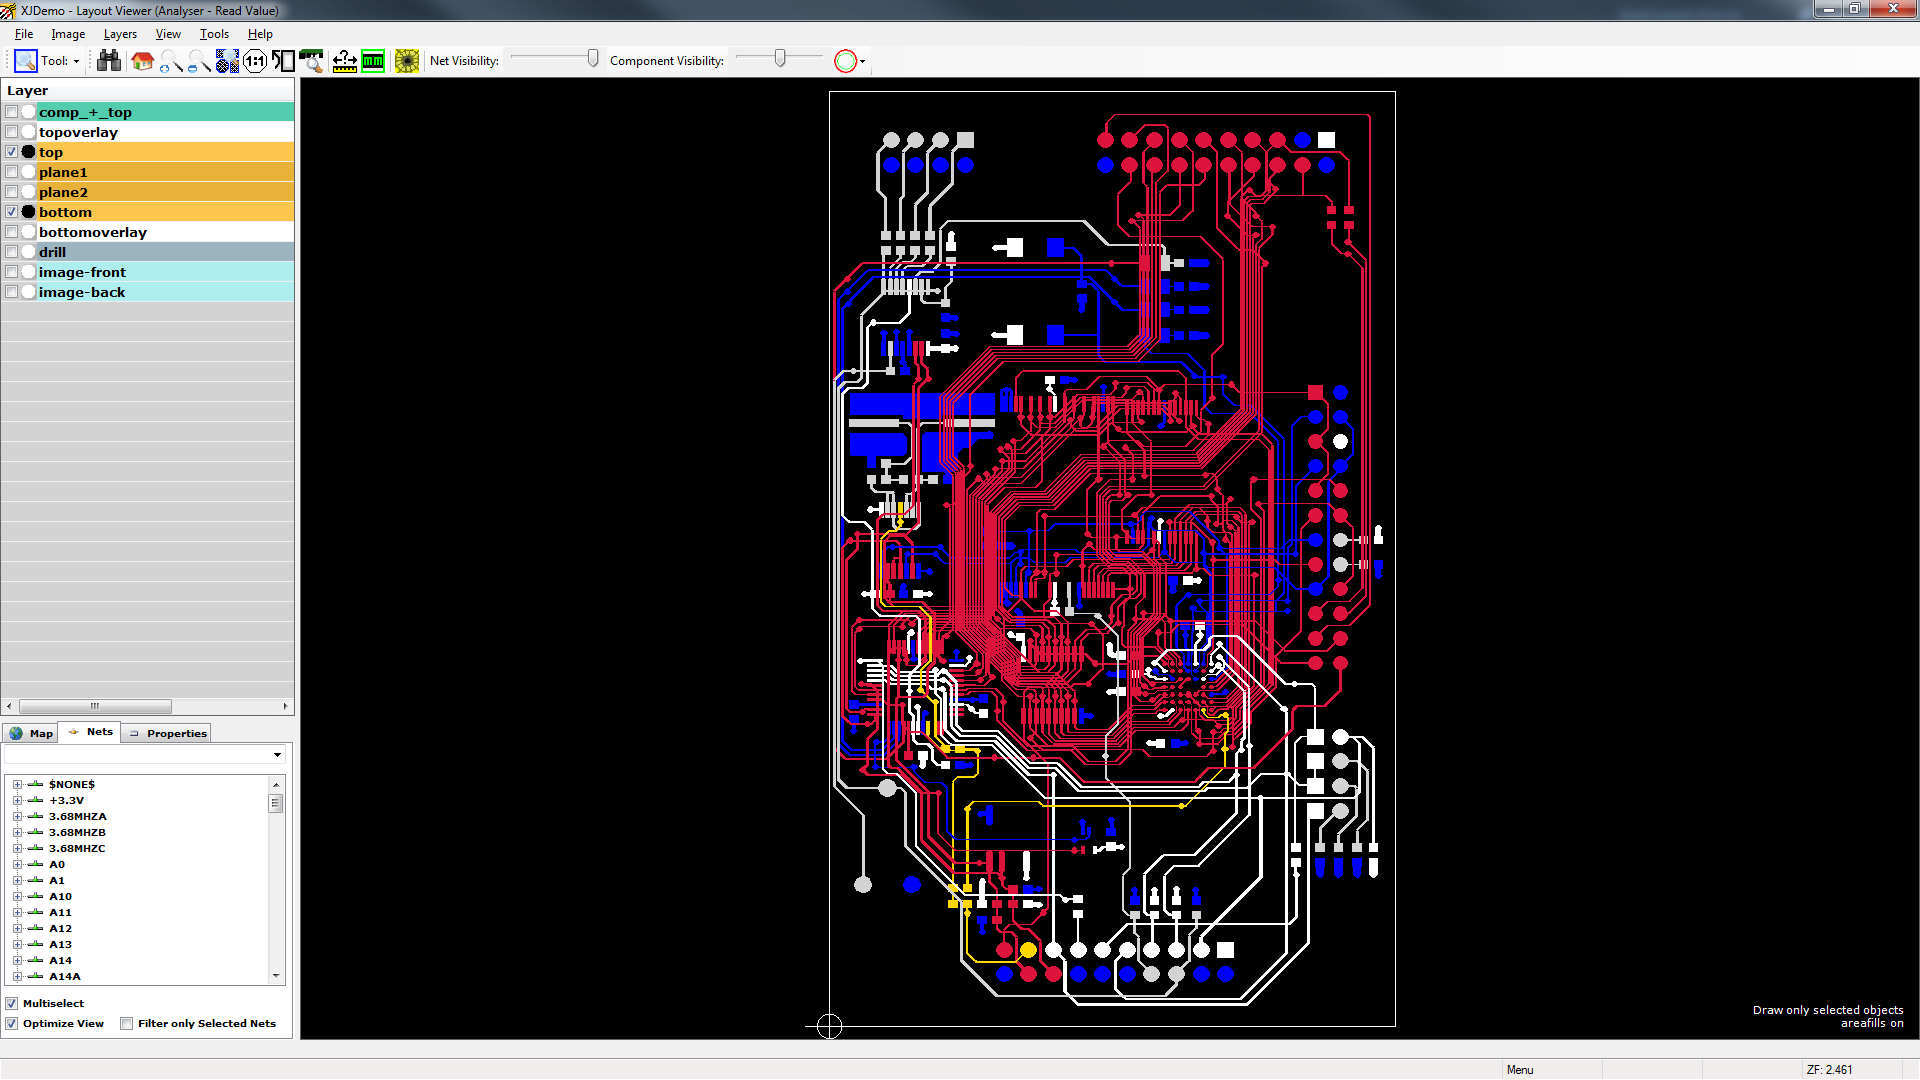
Live pin data from Analyser
Leave A Comment