From XJTAG version 3.8, the XJEase debugger in XJDeveloper now comes with a Waveform View providing more information about the XJEase code being executed.
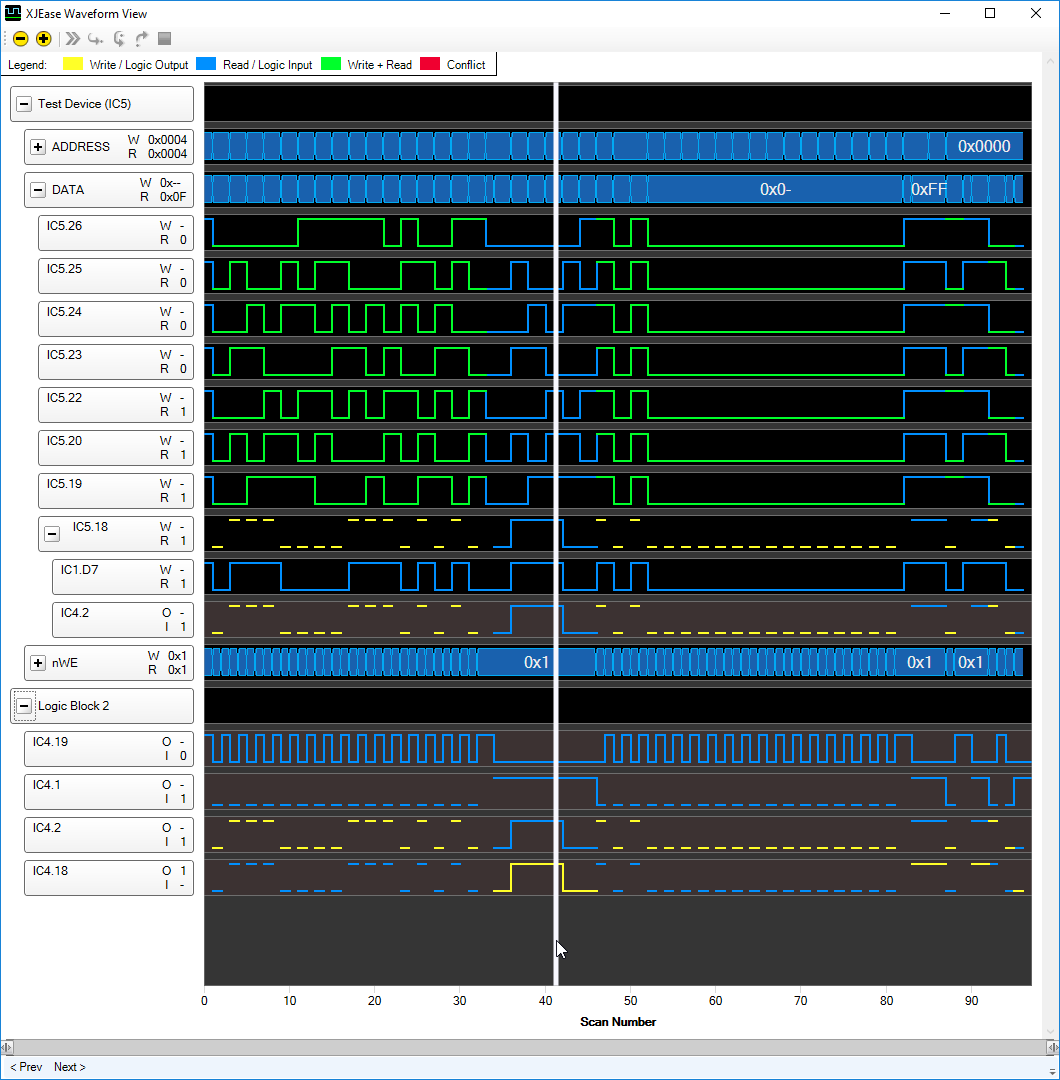
The XJEase Waveform View is designed to show you what your tests actually did in a style similar to that of a logic analyser, however instead of the bottom axis representing time, it shows the number of scans since the start of the capture. After a captured test has been run, or during the test if a breakpoint is hit, the waveform will display read and write information for the pins of the test device. It can additionally show read and write information about any JTAG, external hardware, PIO, and logic pins in the circuit.
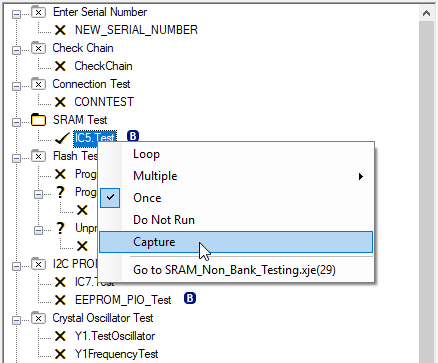
To capture data for a test, right click the test on the Run Tests Screen and select ‘Capture’:
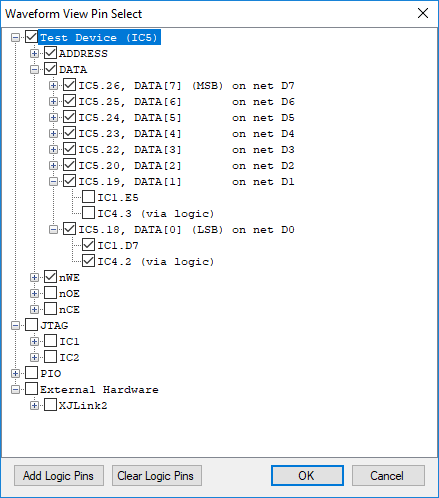
Then select the pins to capture information about:
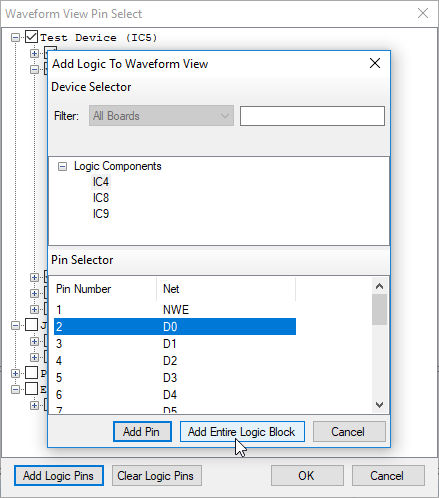
Logic pins and complete logic blocks can also be added:
Now run the test. Once it has completed, the XJEase Waveform Window will open and display all the captured pins information:
It is important to note that selecting a test to capture will mean the test runs slower, so timing-critical tests may behave differently when being captured. Also it will not capture scans inside TRST sequences, CONNTEST, Raw JTAG, or code inside XJModule files.
Leave A Comment