The blog article ‘Debugging Connection Test – part 1 (Updated)‘ discusses how to use ‘Debug Connection Test’ to identify a missing disable value. However, if a disable value is set to the wrong value, i.e. low rather than high, then it could prevent the Debug Connection Test from running at all. In this case, XJDeveloper’s Analyser screen can be used to help locate the issue.
If the Signal Integrity tests all pass (these can be run from the Pin Mapping screen), but the Debug Connection Test screen reports an immediate failure with a broken chain, it is a good indication that there is an incorrectly set Disable value causing the JTAG Chain to be reset or disabled as soon as the devices are switched into JTAG boundary scan’s EXTEST mode. Using the Analyser screen of XJDeveloper, the JTAG devices can be put into SAMPLE mode and then switched one at a time into EXTEST to see which device is causing the chain to break.
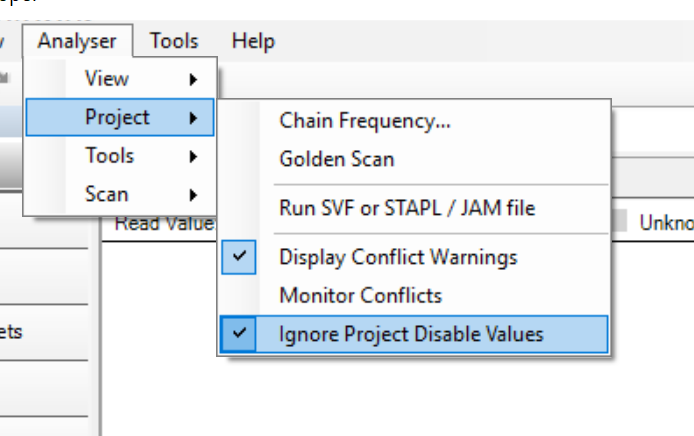
To verify that the problem is an incorrect disable value, in the Analyser menu, choose ‘Project’ -> ‘Ignore Project Disable Values’.
Put the JTAG devices into SAMPLE mode by right-clicking on the white space inside each device and choosing ‘Device Mode’ -> ‘SAMPLE’. After clicking the play button, the chain should run without breaking, (this is the same scenario as the signal integrity test running in SAMPLE mode).
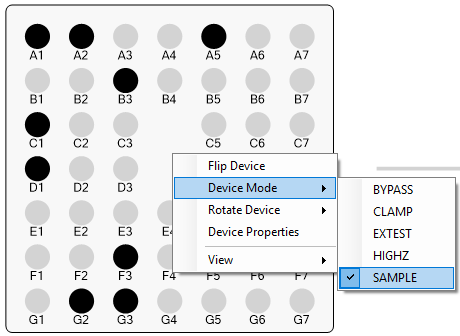
Deselect ‘Ignore Project Disable Values’ and then switch the devices one at a time into EXTEST mode (and back to SAMPLE if the chain does not break). Once the chain breaks, this identifies which JTAG device has an incorrect disable value set. Finding the source of the problem may simply be a case of reviewing the schematic, looking for reset pins or power supply enables, for example. If the problem is not obvious, the Analyser screen and the Netlist Explorer can be used to further investigate. To open the Netlist Explorer, right-click on the JTAG device and choose View->Explorer.

In the Explorer window, scroll to the right to find the ‘Net Disable Value’ column and then click on the column header (twice) to sort. This will display all the pins on this device that have disable values, constant pins, or compliance settings, including the value to which the net is driven. Using the Analyser screen, the device can be switched back into SAMPLE mode and a comparison can be made between the states of the pins in the two modes.
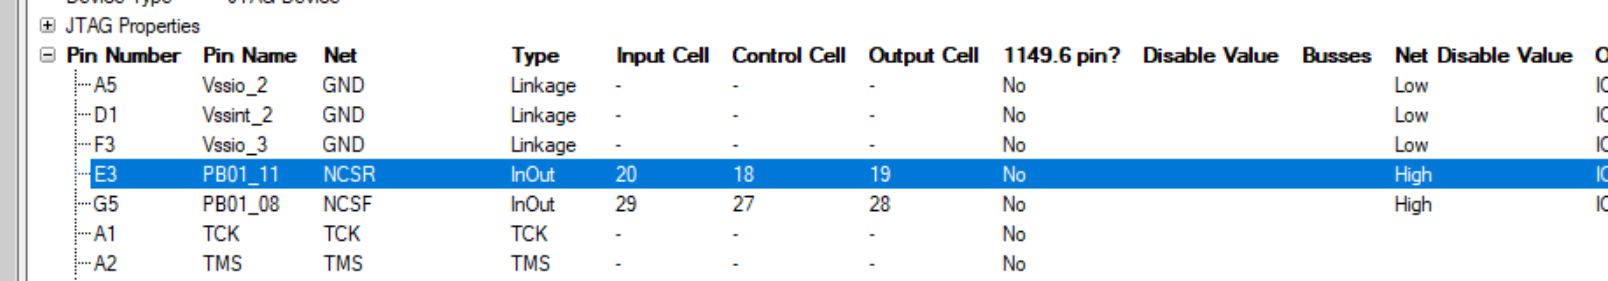
Another cause for the chain breaking could be the absence of a disable value or constant pin, i.e. a net that needs to be driven but is not. Again, the same process as above can be used but in reverse. Look at the states of the pins on the device with it in SAMPLE mode and see which pins are driving (typically you will be looking for a pin that is driving a fixed state rather than one that is toggling) that are not listed under the ‘Net Disable Value’ column. When doing this analysis, it is worth changing the ‘View’ setting to ‘Write Value’. The reason for this is because ‘write only’ pins (pins without input capabilities) will not show the state of the pin with ‘View’ set to ‘Read Value’.

Leave A Comment